Showing posts with label Math. Show all posts

Thursday, September 24, 2015

Another pedantic letter to the editor

Last week this article was published in the Teaneck Suburbanite, with the following lines (emphasis added):
Trains carrying Bakken crude oil from North Dakota travel through Teaneck and other Bergen County towns regularly before arriving at a refinery in Philadelphia. Their numbers have increased exponentially in the past few years, and several derailments have occurred in Canada and across the United States.
Well, I felt the need to respond, and this week they printed my letter to the editor:
To the editor,
A recent article about the freight trains carrying Bakken crude oil running through Teaneck ("Resolution for trains to stop idling passes", Sept. 17, 2015) claimed that "[t]heir numbers have increased exponentially in the past few years..." This is not correct. "Exponentially" is not a more dramatic way of saying "rapidly" -- it means "at a rate proportional to the current value".
According to data from the U.S. Energy Information Administration (http://eia.gov/dnav/pet/pet_move_railna_a_epc0_rail_mbbl_m.htm), crude oil traveling by rail from the midwest (i.e. North Dakota) to the northeast (i.e. Teaneck) has increased roughly linearly since 2012, at a rate around 4.3 million barrels per year (see: http://imgur.com/B9HmRfC), which corresponds to approximately 6,000 extra tanker cars per year.
While the (linear) rate of increasing oil traffic may still be very concerning to residents, like myself, who live within the "danger zone" of the tracks, we should, at the very least, be accurate in our descriptions of the situation.
Eli Lansey, Ph.D.
Teaneck
Here's the plot I link to:

Thursday, February 13, 2014

The 1929 market chart is not scary!

The Wall Street Journal's MarketWatch blog recently posted an idiotic chart comparing the behaviour of the Dow Jones Industrial Average in the months leading up to the stock market crash of 1929:

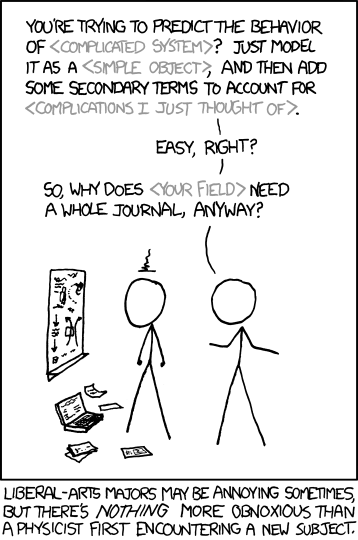
I want to preface the rest of my comments by the following disclaimer: I am not a financial professional -- I leave all serious finance stuff to my talented MBA wife. My approach to economic issues can be summed up by this XKCD comic:

With that out of the way, let's continue. Aside from the fact that the Dow Jones Industrial Average is stupid, there are lots of people commenting on the two-scale axes thing. See here or here, for example. Their basic complaints are that it's not fair to compare the two sets of data because they are scaled to overlay. This is what they look like on the same scale. The red portion is the scary part leading up to the crash:
A little more clarity can be seen graphing these on a log scale:


In any case, this is where my lack of economic knowledge comes in -- I have no idea if that's a good argument or not. But, the graph is still nonsense. First of all, that graph is especially bad, since they didn't scale things correctly and also left out the range of dates used for the 1928-29 dataset. I've done my best to replicate and correct it:
Here, the past and current DJIA values are scaled to fit in the same window. As you can see, there is quite a lot of overlay between the pre-crash data and current data... so perhaps it is scary?

Second of all, and more importantly, I suspected that there were lots of times when the market looks like it does now. So, I wrote a program to go through every 84 week hunk of Dow data and compare it to the current period. This is a graph of the norm of the difference between past periods and the current period:
As you can see, there are many times where the difference drops and there is a time where the Dow's behavior is similar to the current one. In fact, the time with the closest overlap began March 16, 1954:
In other words, this point:
In other words, EVERYONE PANIC!!!   Oh... wait... maybe not. The thing is, people see patterns everywhere, even when they don't exist. To show you what I mean, I made this video:
There's a LOT of self-similarity in the Dow Jones Industrial Index, so it's not surprising that some arbitrary hunk of time-series data looks like another arbitrary hunk. But there is nothing "eerie" or scary about it.

Friday, November 08, 2013

3rd Grade Math Fail

A friend sent me this question from a 3rd grade math assignment:

I'm not even going to start on the stupidity of these sorts of 'plug and chug' assignments. This teacher is teaching something that goes beyond nonsense (just what is a "multiplication sentence" anyway?!?), and is just plain wrong! The phrase 'six times three' means the exact same thing as 'three times six'. Multiplication is (generally) commutative. Furthermore, the following should also be perfectly valid multiplication sentences deserving of full credit:

  • 1*18
  • 2*9
  • (√18)*(√18)
  • -18i*Exp[i*pi/2]
No wonder so many kids think they're "not good at math." They're being taught mindless drivel -- that doesn't even have the small benefit of being, at least, correct. And they've certainly never learned math.

Thursday, June 06, 2013

Too many emails

Our synagogue, Congregation Shaare Tefillah, has an email list for members. I've noticed an increase in the number of emails I've been getting over the last few months, so I decided to see how bad it is. I've discovered that the number of emails going out has been increasing exponentially. That means that not only are the numbers of emails going out increasing with time, but the rate of increase is increasing with time, too:

The number of emails going out is doubling just over every four years. In seven years we'll have 200 emails a month (or 6-7 a day). It is worth noting that the month-to-month variation in number of emails is increasing, so even if it looks like "Hey, we had fewer emails in month x", it's entirely likely that the next month will be higher:

I recognize that some of this is due to our rapid growth as a shul. However, our emails per member ratio has also been increasing:


The two curves correspond to an exponential fit to both members and emails (the better fit, IMO) and a linear fit. In both cases the number of emails sent increases at a larger rate than the membership.

I'm sure there's something that can be done about it, but, for now, I just set up an email filter...

Thursday, July 05, 2012

Euler's toilet function

I was recently reading the Wikipedia article on Euler's totient function, and thought that I couldn't be the only person who initially read it as "Euler's toilet function." A quick Google search later turned up this Wikipedia clone with the key line:

This number lies in the n-th cyclotomic field — and in fact in its real subfield, which is a totally real field of degree over the rational numbers
    ½φ(n)
where φ(n) is Euler's toilet function.
Bingo! Note, this has been fixed on Wikipedia a long time ago. This also highlights the danger, and potential hilarity of Wikipedia clones.

Thursday, May 03, 2012

Why science literacy is important

This post is largely a followup to last week's science literacy post. First of all, here's an excellent comic from Spiked Math, posted just two short days after my rant about using any symbol you want:
Followed nicely by an xkcd comic:

And yet, it's really important to learn math! One of the regular complaints heard from pre-med students is that they're forced to take some physics (which requires math) in order to get into med school. They complain they'll "never use it" or some other similar whine. But, here's an article, published in 1994 in the journal "Diabetes Care," a high-impact, peer-reviewed journal, where the author describes an incredible new way of calculating the area under curves (which she then names after herself!):
In Tai's Model, the total area under a curve is computed by dividing the area under the curve between two designated values on the X-axis (abscissas) into small segments (rectangles and triangles) whose areas can be accurately calculated from their respective geometrical formulas. The total sum of these individual areas thus represents the total area under the curve. 
In other words, the so-called "trapezoid method," known well since the time of Isaac Newton, around 300 years earlier! This method is well documented in every calculus textbook out there, and yet this paper got published, and is cited (often!). While I think that having science literacy is an integral part of being a functioning member of an advanced human society, at a most basic level, a nice outcome of science literacy is that you (either as an "author" or a "reviewer") don't seem like a total moron!

Fortunately, many people responded to this article with nicer versions of "You moron!", but her indignant defense was, and I paraphrase, "I didn't know about this rule before, and I figured it out myself, so it's still original, and I can publish it!" While I commend her figuring it out (I really do!), original (i.e. publishable) research is not just something you figured out by yourself, it is something that no one else has figured out before! The "find out someone already did this" and "they figured this out 50 years ago" phases are an integral part of the scientific method, as described nicely in this rage comic from the Electron Cafe:
And on that note, back to my research...

Thursday, April 19, 2012

Some old exams

When going through some old papers recently, I came across some AP calculus exams:
There was a reason I was concerned about majoring in physics in college... and then I found out that AP Calc is not math, and it got better.

Thursday, June 02, 2011

The Flag

I decided to participate in Playing with Mathematica's "make a US flag using Mathematica" contest. Making the stripes and blue section is fairly trivial to do in Mathematica, so I won't go into that. But, I like my method for making the stars. There's a little bit of math here, so feel free to skip down to the pictures at the bottom.

First, note that a five-sided star, like that on the US flag, can be constructed as follows:

If you take a regular pentagon (thick black lines) and connect all the vertices (numbered blue dots), you sketch a star. Alternatively, if you start with one vertex, and, traveling in a counter-clockwise direction, skip a vertex and connect the two, and repeat you get the same thing (i.e. line from 1 to 3, then 3 to 5, then 5 to 2, then 2 to 4, then 4 to 1).

However, to sketch the perimeter of the star, you also need to include the lettered vertices of the smaller, red, pentagon which is formed by the inscribed star. To get the resulting star shape, you need to connect the vertices in order:

The way I did this in Mathematica was using complex notation. The corners of the pentagons in the Complex Plane are given by
where n is an integer from 0 to 4 and A is the length from the origin to a corner (I rotated them by pi/10 to straighten the thing out). If A for the outer pentagon is 1, then the inner one is
.
Then, to get the vertices in order, you just need to sort them in order of Argument. All this is pretty easy to do in Mathematica:
starVert = (#1[[Ordering[Arg[#1]]]] & )[Join[E^(I*(Pi/10))*Exp[2*2*Range[6]*Pi*(I/5)], (1/2)*(3 - Sqrt[5])*E^(I*(Pi + Pi/10))*Exp[2*Range[6]*Pi*(I/5)]]]

Then I just mapped Re[coords] to x and Im[coords] to y, tiled the stars on the flag, and:

But, I wanted to make the flag wave. To do that, I summed 7 time-dependent sin curves in 2D with (bounded) random wavevector and frequencies. A resulting surface looks like this, for example:
Then, I used Mathematica's Texture functionality to use the flag Graphics I created on the surface:
And then, I animated it (click through for the subtle effect):

This was the one I submitted for the contest. Since then, I've seen Eric Brodeur's amazing Mathematica flag:
which is far better than the one I submitted. I'm not sure why I decided to do a top-down view, rather than the side view (also, I'm not sure how he got rid of framing boxes around the surface). Anyway, it's been fun.

Tuesday, November 16, 2010

We Demand New Variables!!!

This post is something that has been on my mind for a very long time.  In the sciences there are a number of symbols that are used a lot. Here are a few of them. 
αa πnηh µuUψ rγyxzλYXZ2 tτTI1lij νvV ωwW κk φσQθϑ εE ρpPζ   I have grouped them this way to demonstrate my issue with them.  In this pristine setting I have a problem telling some of these apart.  Now think about a classroom with a teacher with bad handwriting, while you try desperately to copy the notes.  Additionally, many of these are used for very different things across disciplines.  On top of that some of these just love showing up intertwined.  Nu and v just love hanging out, as do Rho and p.  As do Epsilon and E in fact σ = Eε.  Now when you add in all the different professors notations for matrices, some like brackets, some like curved brackets and some like parentheses. Then you add in notations for vectors, scalars, time derivatives, partial derivatives, subscripts, and superscripts. I have had these include lines over and under, dots above, apostrophes, and tildes.  I have had problems that have derivatives, partial derivatives, regular and capitol letters of x, y, z, u, v, w and p as well as Nu and Rho.

At the end of the list I have added Zeta, because I have had no two professors every draw it the same and once it took me two lectures to figure out that the squiggly the teacher was drawing was Zeta.

Thursday, July 22, 2010

Happy Pi Approximation Day

March 14, "Pi Day" gets all the publicity here in the US because of the date structure MM/DD.  This means Americans write that date as 3/14 which are the first three digits of Pi.  But, just about everywhere else in the world uses the format DD/MM.  In that case, 14/3 is kind of silly.  However, today, July 22 is meaningful!  22/7 is a decent approximation for Pi!  In fact, 3.14 differs from Pi by around 0.05% whereas 22/7 differs only by around 0.04%!
So, Happy Pi Approximation Day! (Whats left of it, at least.)  And, in honor of Pi Approximation Day, here's the awesome birthday/father's day present Stacy got for me this year:

Thursday, March 26, 2009

A new blog

I have started a new blog called Behind the Guesses.  It is by and large a physics / math blog, so I imagine only a subset of our normal readers might find it interesting.  At the moment I only have an intro post, but I have an exciting post all ready for Monday, so check back then.
Here's a small preview of some topics you can expect to see:
  • The Quantum Harmonic Oscillator Ladder Operators
  • Newton's Laws
  • The Dot and Cross Products
  • And more...
And here's an excerpt of Monday's post as a sneak preview:
Now, at this point, many texts define, with no motivation other than future ``convenience'', two operators

(5a)
(5b)
and proceed to show how these can be used to simplify the Hamiltonian and easily solve the problem. While it is an elegant and quick solution, this presentation is completely useless. I find it highly unlikely that Dirac sat down to solve this problem and tried a whole series of random operators


and so on, along with their complex conjugates, until he lucked out with the solution in (5)...
See you all there!

Thursday, November 27, 2008

How to identify a math major

I recently received a lab report that was stapled in an interesting way.
Just in case you're having trouble seeing what happened here, the student first used a stapler designed for many pages (I think it's for over 45 pages, but I'm not sure) on a stack that was way too short.  He did this three times. Then, for good measure, he topped it off with a standard staple (after a misfire, first).
Needless to say, this student is a math major.

And, Happy Turkey Day to all our American readers.

Sunday, October 05, 2008

My Google Tech Talk & Google Israel

I have earlier mentioned my research into GoogleWhack and Internet Search Result Probabilities way back when I was starting it in 2006, then when I put up a poster at an NJIT conference. Its also been here on my Alternate Resume for a very long time (once I stopped being paranoid someone would steal my idea).

Last semester I wrote a paper on it with Bruce Bukiet. The paper was accepted to the Journal of Quantitative Linguistics published by Taylor & Francis. It should be out by the beginning of 2009. While its not an incredibly high Impact Factor Journal, this will be my first publication in a peer review journal so I'm excited for it. You can read a pre-print of the paper here.

Last May, I also gave a "Tech Talk" at Google's New York office on my research.

Here is the Video of my Talk:


Google NYC Lobby


We werent allowed to take pictures inside of the Google office, but in the lobby was okay. I for some reason didn't get a picture of myself there . . . whoops.
Thanks to my friend Ran, I was able to visit Google's Tel-Aviv office last summer (not really related in any way to my research- but it gave me something to talk about.. No pictures were allowed there either but I managed anyway.


This Mezuzah had Google colors and I thought it was quite tastefull. The view looks into the Lobby.

Tuesday, January 22, 2008

Back to School

Well to all of you university students out there welcome back to school. For all you other people , well you have been back to school or work for at least two weeks, so whatever. My first day started with a bang, well actually it started with the professor not coming to class "weeeeeeeeeeeeeeeeeeeee." This of course resulted in me not having anything to do for 5 hours, but I managed to entertain myself. Now come the piece de' resistance, Aerospace Propulsion. The entire lecture basically talked about what we where going to be doing all semester, the list is 24 items long, it contains scary sounding things like nuclear, specific impulse, diffusers, combusters, compressors, afterburner Brayton cycles, multistage compression, and elementary reaction kinetics. Sounds like fun; well mabey only for people like me but what the heck thats all that matters because I am the one taking it.

Tuesday, November 20, 2007

Doublet, Source or Sink

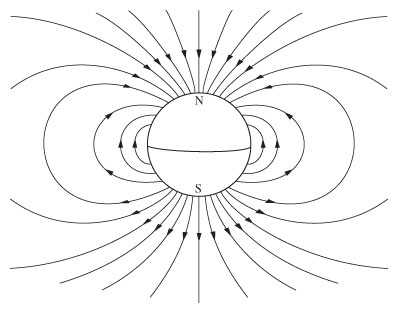
Warning geekiness will follow, if not interested just skip to next section. Source or sink? Well as it turns out a doublet it both. It is where you have a source at –B and a sink at B then you let B → 0. So basically you have a source (radial flow outward) and a sink (radial flow inward) in the same place, the flow resembles a dipoles field lines. Why do I mention this, well as it happens if you have a doublet and put it in a uniform flow (a flow at constant speed) the system mathematically models a cylinder in a uniform flow. Now the cool thing that arises from this is what is called the D’Alembert’s Paradox, which is if you solve for the net force acting on the “cylinder” it works out to be zero which can’t be right since the constant flow should apply a force. This was solved by Ludwig Prandtl who introduced the concept of boundary layers, this allowed for there to be a force. Now the really cool geeky thing about this is that if you can make a doublet and use a superfluid for your fluid you can theoretically get no net force on the cylinder in a uniform flow.

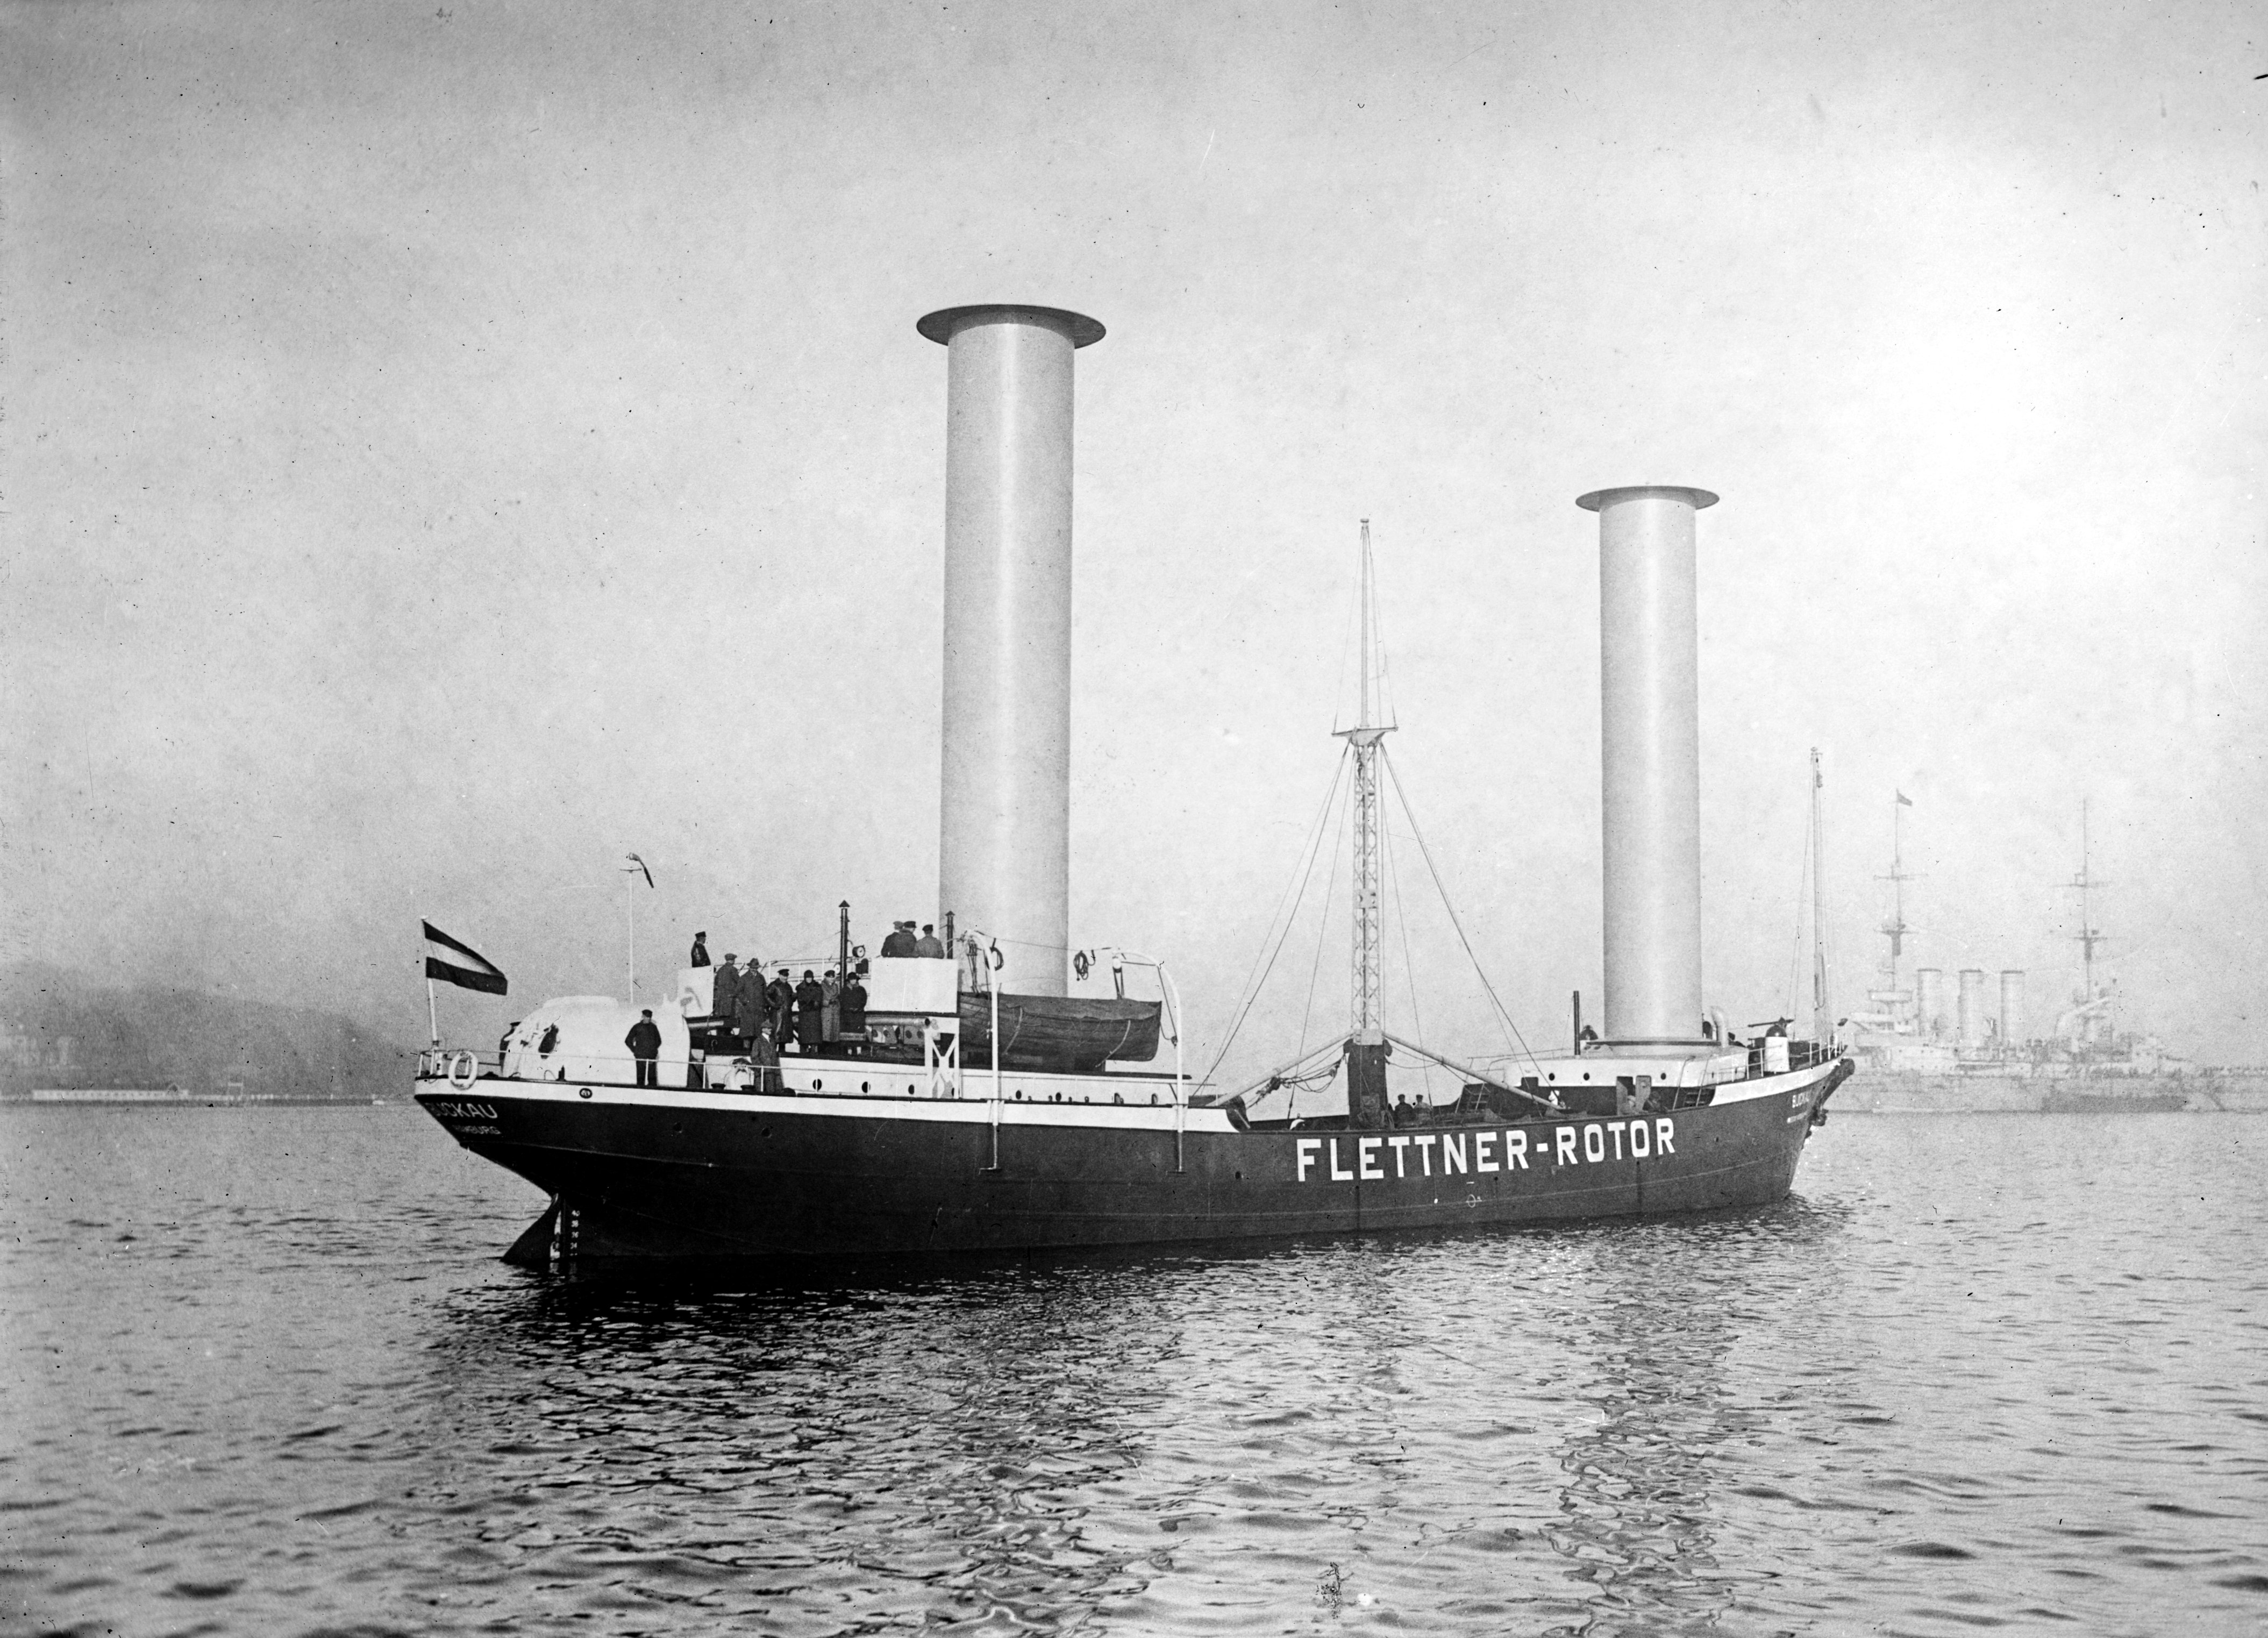
Now on to the fun for everyone part. Based upon the stuff above (which you don’t need to read) if you add a vortex to the system, that is take a spinning cylinder in a flow you get a lift force acting perpendicular to the initial flow, this is called the Magnus Effect. From all this you get Anton Flettner who invented the Flettner Rotor Ship.


This actually crossed the Atlantic. He also invented a rotor mill (which I can't find a good picture of), which used the same principle as the ship; it was a windmill that for the paddles had spinning cylinders.

Sorry about the massive amount of technical geeky stuff in this post.

Sunday, March 18, 2007

Things not within Biking distance of Newark and a Neat Effect


This is a good example of the "ringed glints" caused by blades of grass and spiderwebs. A very similar looking effect working by the same principle can be seen the following way: Sit behind someone driving in a car at night. Look at some light (headlight, taillight, traffic light . . .) through that persons hair (this works best with long haired front seat passenger/drivers). All the little bits of hair curves that are oriented properly will have great reflections, normally full circle like, probably better with curlyish hair. Someone out there should take a picture of this and send it to me (would be apreciated).
The full size picture:


I did ask these guy's permission to take a picture first.


You may be wondering how I was so lucky to get all these pictures in before the sun set. Well the sun never properly rises in winter here so pretty much it take a few long hours to set - which is nice.

Something remotely similar to the following might have been within biking distance of Newark but I still really like this picture cuz of the car shadows so I decided to put it in. Technically in NJ the odds of me coming to this scene with the sun at this angle are so low (unlike in England that I'm alright keeping this posts title).